The MIT Sloan Sports Analytics Conference kicked off Thursday with its inaugural Hackathon – an event hosted by ESPN Stats and Information.
The Hackathon brought together 13 students and 14 professionals with the goal of using ESPN’s state-of-the-art NFL data to create a cutting edge, innovative data visualization.
Upon arrival, the participants were given the back-end data that ESPN utilizes to tell stories everyday. They were tasked with deciphering the code and producing a creative NFL visual.
The winner of the student division will be offered an internship within ESPN Stats and Information, and the professional that comes out on top will join ESPN for dinner Friday night.
Jessica Gelman, The Kraft Sports Group’s Vice President of Customer Marketing & Strategy and co-founder of the MIT Sloan Sports Analytics Conference said of the Hackathon, “For the conference we are always looking to innovate and provide new opportunities for people to think about sports analytics. This (Hackathon) seemed like a natural fit.”
Hopes were high heading in the event on both ends and the participants did not disappoint.
The student came from USC, MIT, Syracuse, Ohio State, Emory, Michigan and elsewhere. Their presentations ranged from the sophomore slump to the Robert Griffin III’s sack rate to the correlation between wins and expected wins in the NFL.
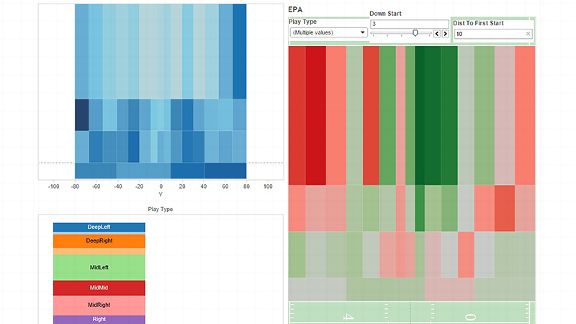
Take a look at this visual below from MIT student Eamon Glackin, one of three student finalists. In three-and-a-half hours, he created heat maps to visualize play-calling frequencies and success rates in 2014.
 ESPN Stats & Information
Play-calling frequencies and success rates in the NFL in 2014.
Meanwhile, in the professional division, scientists, investment analysts and others impressed with their interactive and static visualizations.
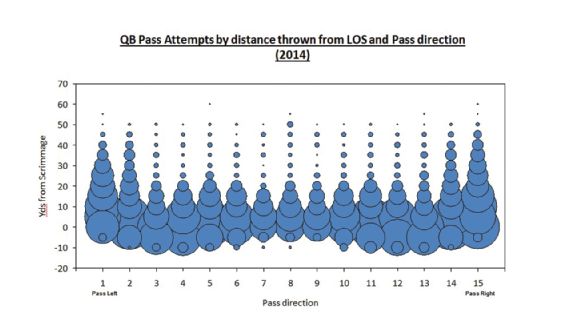
One attendee created an excitement index, while others used the data to analyze play-calling and run/pass tendencies. Below is a pass chart crafted by Barnett Koryan from Capital One Bank showing pass attempts by frequency.
 ESPN Stats & Information
Visualization of pass attempts by direction and yardage last season.
The inaugural Hackathon brought a diverse applicant pool with innovative ideas. Just as the MIT SSAC has grown tenfold over the last eight years, this is only the beginning for the Hackathon.
